.webp&w=3840&q=90)
How to Annotate Trading Charts in Real Time: The Best Screen Tool for Traders, Analysts & Educators
Draw trend lines, mark support & resistance, and annotate live charts over TradingView, MetaTrader & Thinkorswim in real time. The screen annotation tool built for traders, stock analysts, forex educators & crypto creators, try Markury free at markury.app
Markury Team
Author
Your Chart Analysis Is Only as Clear as How You Present It
You've spotted the setup. The trend line is holding, price is compressing into a key resistance zone, and the risk-reward is clean. You know exactly what you're seeing, but the moment you try to explain it to your trading room, your students, or your YouTube audience, something gets lost.
You're pointing at a chart on screen, describing levels verbally, hoping your audience is following along. But without being able to draw on your screen in real time, circle that pattern, mark that level, draw that trend line directly over the live chart, your analysis lands at about half its potential impact.
This is the problem that thousands of day traders, swing traders, stock market analysts, forex educators, crypto content creators, and options traders run into every single day. And it's exactly the problem that Markury was built to solve.
If you're looking for the best screen annotation tool for traders, one that works over any platform, doesn't slow your machine down, and gives you the precision tools your analysis deserves, this guide covers everything you need to know. By the end, you'll understand not just what Markury does, but exactly how it fits into your trading workflow.
Why Every Serious Trader Needs a Screen Annotation Tool
Trading Is Visual: Your Tools Should Match That
Trading, at its core, is a visual discipline. Price action, chart patterns, support and resistance zones, trend channels, Fibonacci levels, every concept you work with exists as a visual construct on a chart. The best traders in the world think in pictures, not words.
Yet when it comes to communicating that analysis, whether to clients, students, or a live trading audience, most traders are working with tools that simply aren't built for the job. Verbal descriptions fall flat. Static screenshots lose the energy of a live market. And trying to guide someone's eyes across a busy chart without being able to point, draw, or highlight in real time creates friction at every step.
A professional screen annotation tool removes that friction entirely.
The Limits of Built-In Chart Drawing Tools
To be fair, platforms like TradingView, MetaTrader, and Thinkorswim all include their own drawing tools. You can draw trend lines, mark horizontal levels, and add shapes directly onto your charts within the platform. For personal analysis, these tools are genuinely useful.
But they have a hard ceiling and traders hit it fast.
Built-in chart tools are locked inside the platform. They can't annotate across multiple windows simultaneously, they don't work during a screen share on Zoom or Google Meet, they disappear the moment you switch to a different application, and they offer no way to guide a live audience's attention in real time. There's no laser pointer. There's no cross-app flexibility. And there's no way to annotate your broker platform, your news feed, and your chart side by side in a single seamless session.
That's the gap a dedicated screen annotation tool fills and fills completely.
When Do You Actually Need to Draw on Your Screen?
The honest answer is: more often than you might realize.
- Running a live trading room and need to mark entry zones, invalidation levels, and targets in real time as the price moves
- Recording YouTube or social media analysis, and want your key levels to appear visually on screen as you explain them
- Teaching a trading course or webinar and need to illustrate chart patterns, candlestick formations, and market structure clearly
- Sharing analysis with clients during a screen share, and want to point at specific price areas with precision
- Reviewing your own trades after the session, annotating your charts for journaling, and capturing screenshots of your setups
In every one of these scenarios, a screen annotation tool isn't a luxury, it's the missing piece that makes your communication land the way your analysis deserves.
What to Look for in a Trading Annotation Tool
Works Over Any Trading Platform
This is non-negotiable. Your annotation tool must work as a universal overlay, sitting above TradingView in your browser, above MetaTrader as a desktop application, above Thinkorswim, above your broker platform, above everything. If it only works in certain environments or conflicts with your trading software, it's not the right tool.
Zero Lag During Live Sessions
In trading, latency is the enemy. A screen annotation tool that stutters, freezes, or introduces lag during a live session is worse than no tool at all, especially when every second counts. The tool needs to be hardware-accelerated, lightweight, and instantaneous from the moment you activate it.
Precision Drawing Tools
Freehand drawing is great for circling patterns and marking zones, but serious traders need more. Clean, straight lines for trend channels. Perfect rectangles for marking consolidation ranges and order blocks. Arrows that direct attention to exact price levels. Circles that highlight candlestick patterns. The full toolkit matters.
A Laser Pointer for Guided Analysis
This is one of the most underrated features a trading annotation tool can have. During live sessions, you often want to guide your audience's eyes to a specific candle, a particular wick, or an exact price level without leaving a permanent mark on the chart. An auto-fading laser pointer does exactly this, leaving a momentary trail that disappears cleanly after a second or two.
Screenshot Capability for Trade Journaling
Every serious trader journals their trades. The ability to capture an annotated screenshot of your chart with your levels, notes, and markings already on screen and save it instantly is a workflow game-changer for documentation, review, and client reporting.
A Clean Interface That Doesn't Obstruct Your Charts
Your charts are your workspace. The annotation tool must live lightly on top of that workspace, accessible instantly when needed, invisible when not. A cluttered, intrusive interface that competes visually with your charts defeats the purpose entirely.
Meet Markury: The Screen Annotation Tool Traders Are Switching To
Markury is a modern, lightweight screen annotation tool built for macOS and Windows that lets you draw, highlight, and annotate directly over any application in real time. It operates as a floating overlay, letting you present on top of everything on your screen, always accessible, never in the way.
Its floating toolbar is draggable, collapsible, and stays on top of every application without interfering with your ability to interact with the software underneath. When drawing mode is active, a subtle colored glow border appears on the toolbar, a clean, unmistakable visual cue that tells you exactly when you're annotating. The moment you switch back to cursor mode, your charts are fully interactive again, and your annotations remain visible on screen.
For traders, this seamless toggle between annotating and interacting is everything. You can draw a trend line, mark a level, point at a pattern, then instantly click through to place a trade, adjust a position, or scroll your chart, without breaking your flow for a second.
Markury Features Built for Trading Workflows
Let's go through the specific Markury features that make the biggest difference in a trading context.
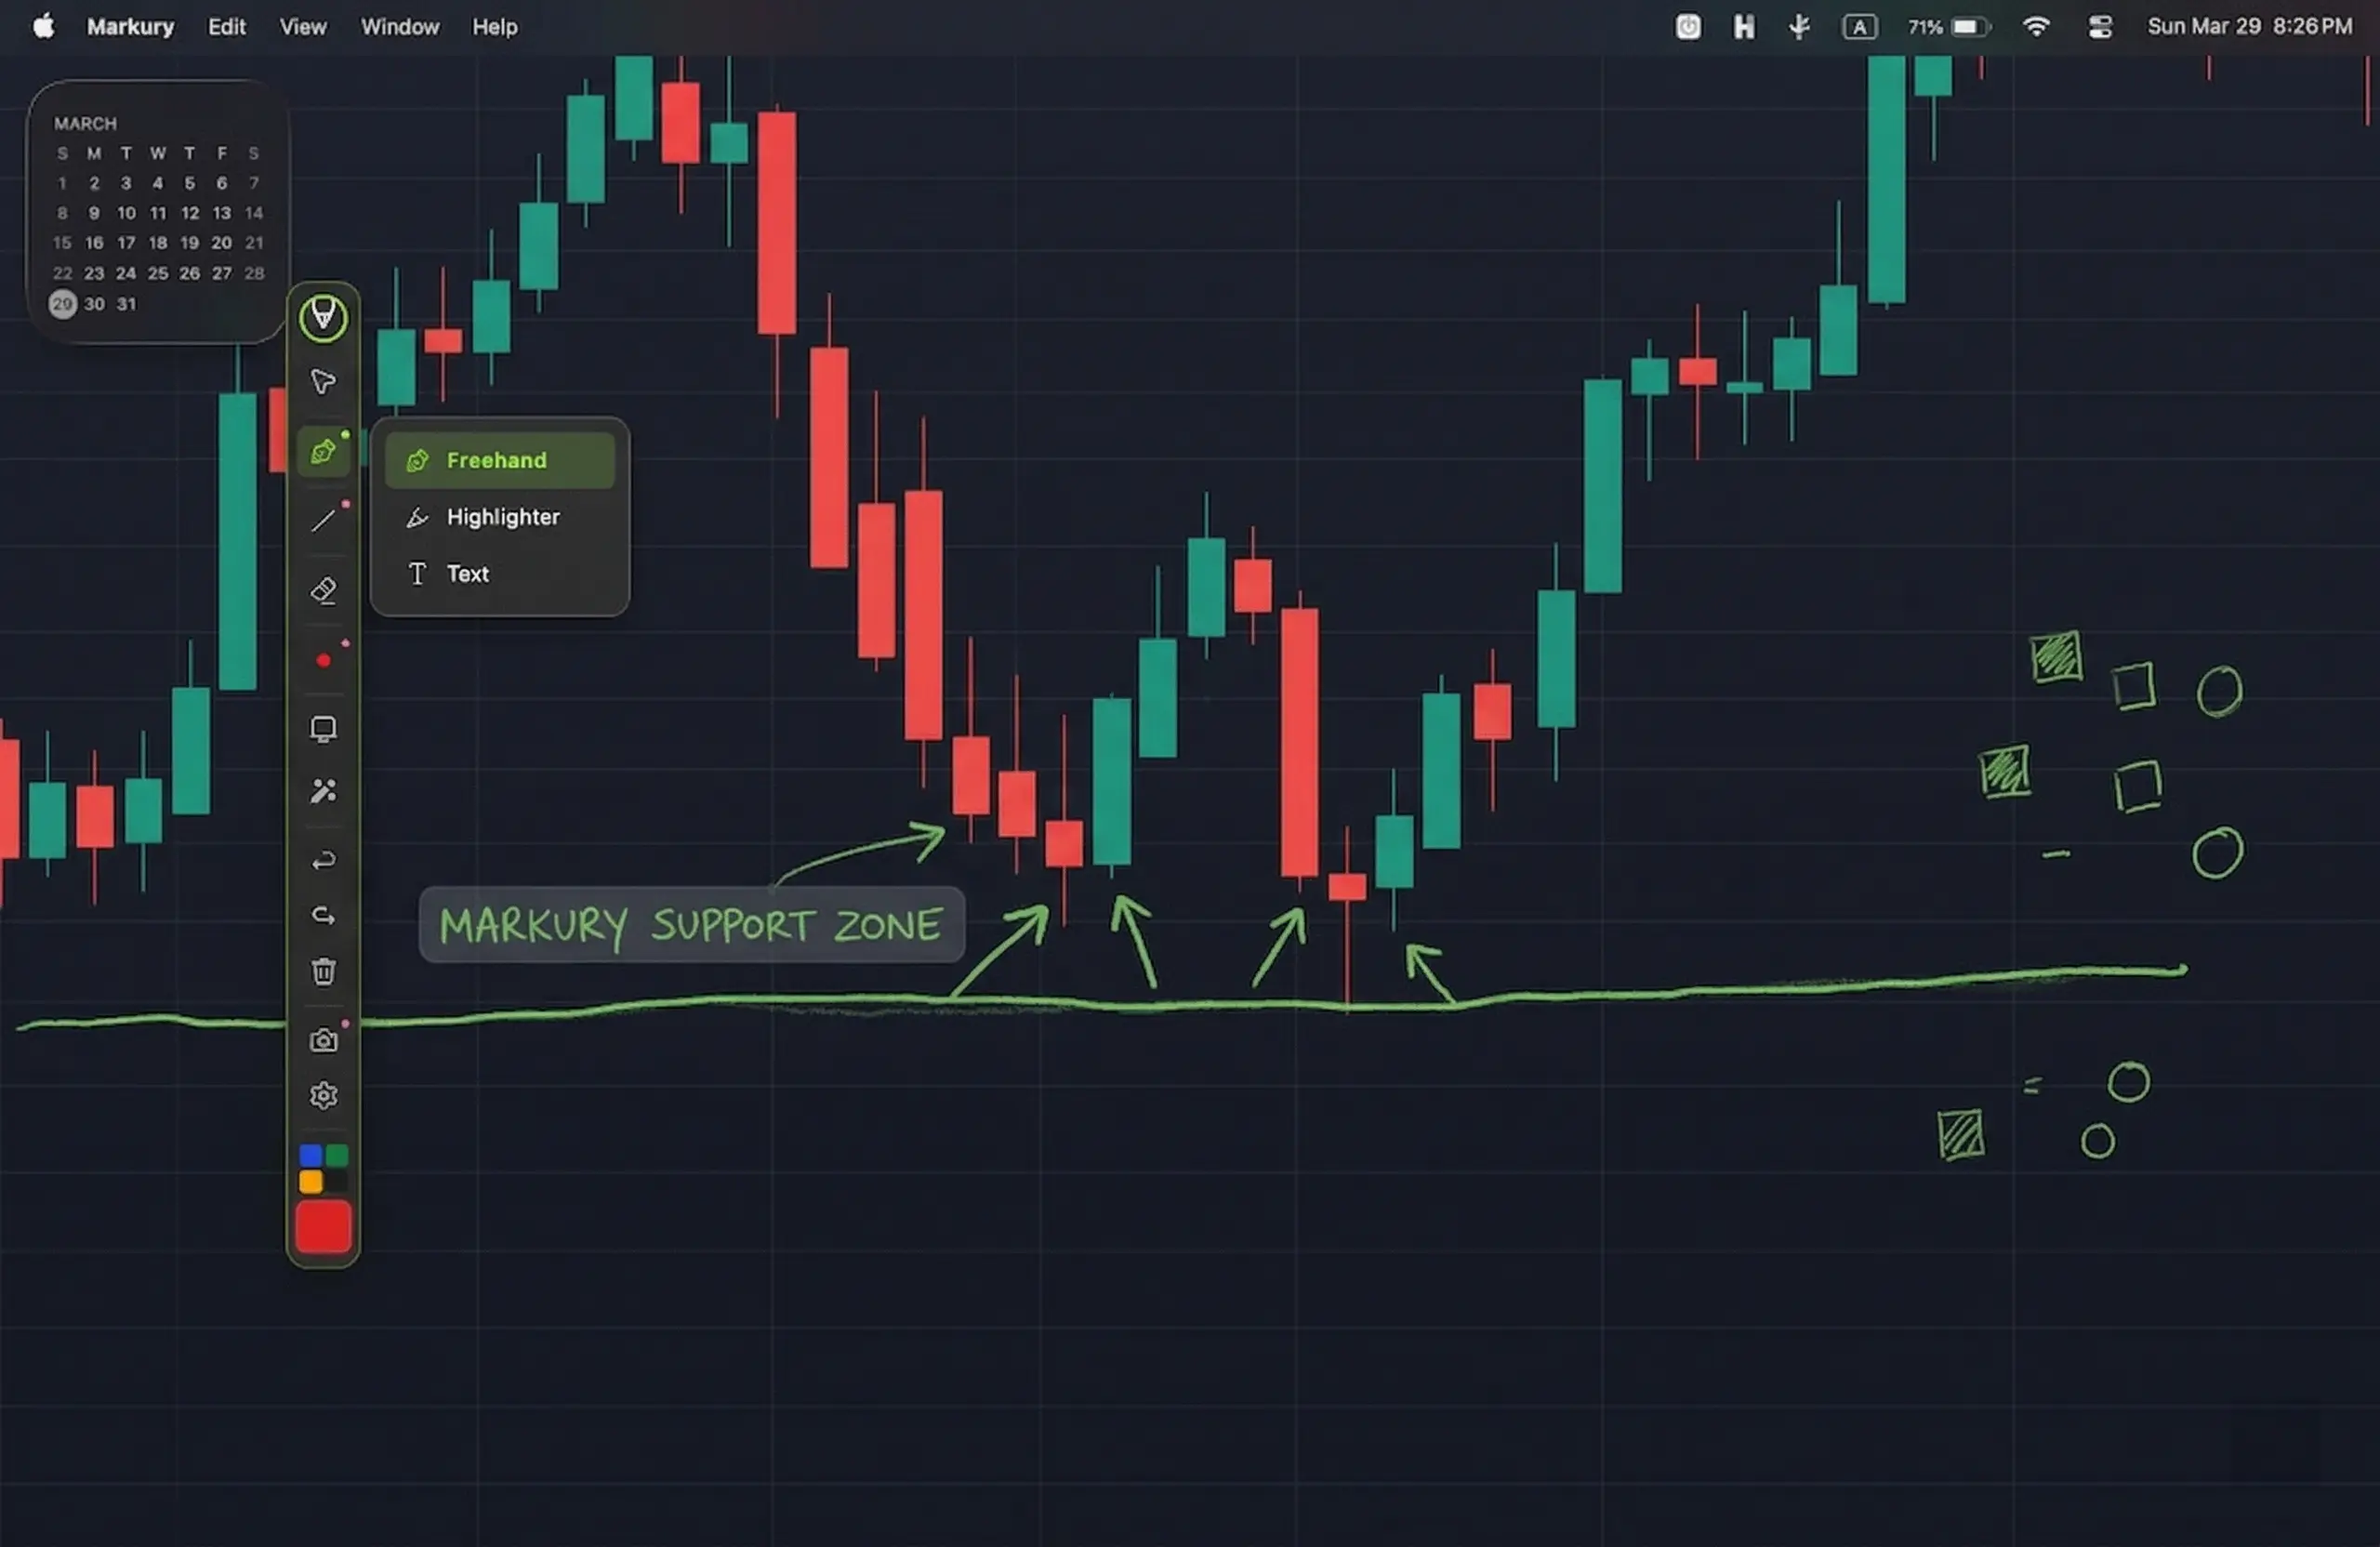
Freehand Drawing: Circle Patterns and Mark Zones Instantly
Markury's freehand drawing engine is smooth, responsive, and hardware-accelerated, meaning your strokes render cleanly at any speed without stutter or lag. Choose from multiple stroke widths for fine detail or bold and draw naturally with a mouse or stylus. Circle a breakout pattern, trace an area of consolidation, mark a demand zone, all with the natural feel of pen on paper.
Precision Shape Tools: Trend Lines, Channels, and Level Markers
Where freehand drawing gives you speed and naturalism, Markury's Pro shape tools give you structure and precision. Draw perfectly straight lines for trend channels and diagonal supports. Use rectangles to frame consolidation ranges, order blocks, or fair value gaps. Circles draw attention to key candlestick patterns. Arrows direct your audience's eyes to exact entry and exit levels during live sessions.
These tools are the difference between an analysis that looks professional and an analysis that looks rushed. When you're teaching or presenting to clients, precision matters, and Markury delivers it.
Laser Pointer: Guide Your Audience Without Cluttering the Chart
This single feature transforms the live trading session experience. Markury's laser pointer leaves a glowing trail across your screen that automatically fades in approximately 1.5 seconds, with no permanent marks and no visual clutter building up on your chart over time.
For trading room hosts and educators, this is invaluable. Point at the exact candle that triggered your entry. Trace the price path to the next key level. Highlight the pattern forming in real time. Your audience follows your eyes, your analysis lands with clarity, and your chart stays clean throughout.
Text Annotations: Label Your Levels and Zones
Analysis without labeling is half finished. Markury lets you click anywhere on your screen and place a typed text annotation in any color, at any stroke width, that's instantly readable and fully erasable. Label your zones as "Support," "Resistance," "Entry," "Target," "Stop Loss," "Order Block," or anything your analysis calls for.
For educators walking through multi-timeframe analysis, this feature alone makes Markury worth it. Your students can see exactly what each level represents, in your own words, overlaid directly on the chart, no ambiguity, no "that line on the left" confusion.
Highlighter: Emphasize Key Price Areas
Markury's semi-transparent highlighter renders over any content while keeping the underlying data fully visible. Highlight a key price range on your chart without obscuring the candlestick data inside it. Emphasize a section of a news article, an economic calendar entry, or a risk management spreadsheet during a training session.
Screenshot With Annotations: Your Built-In Trade Journal Tool
This is where Markury becomes more than a presentation tool; it becomes a complete trading documentation system. With a single shortcut, capture a full-screen or region screenshot of your annotated chart, auto-timestamped and saved directly to your desired local folder or clipboard.
Your trade journal entries now include exactly what you saw, exactly how you marked it up, at the exact moment you made the decision. For serious traders committed to continuous improvement, this workflow is a significant upgrade over manually screenshotting and then opening an image editor to add notes.
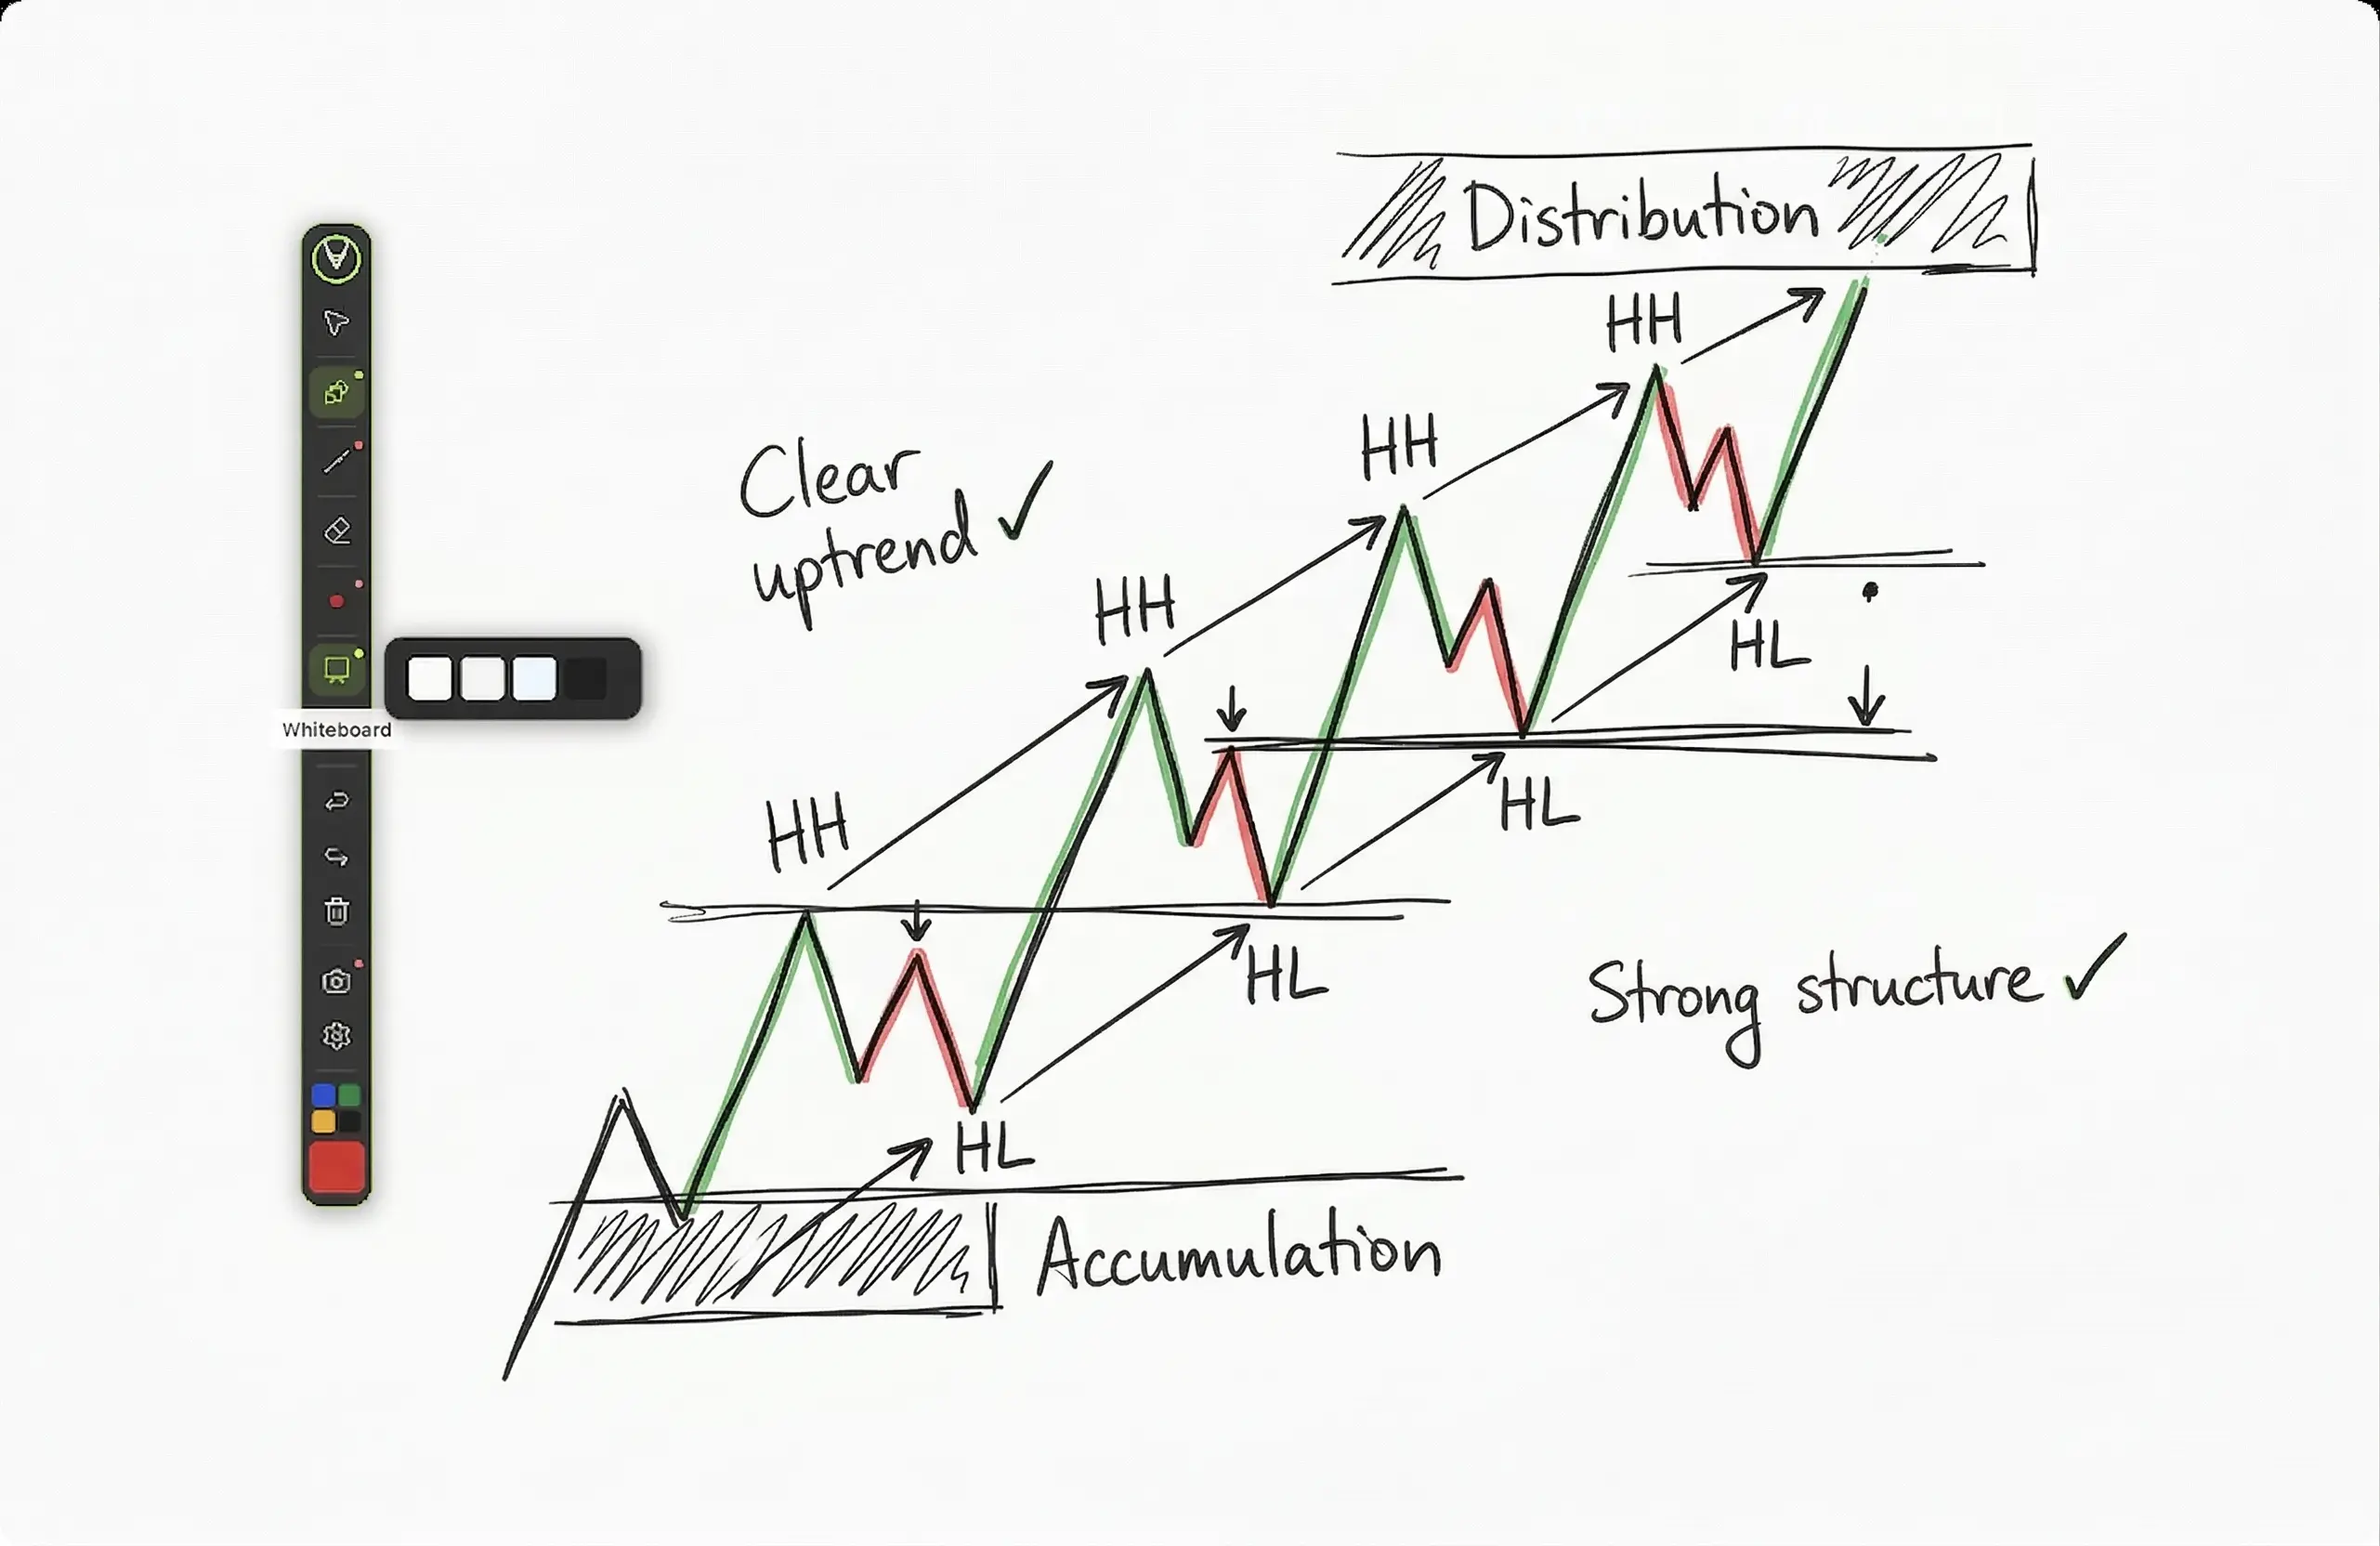
Whiteboard Mode: Teach Chart Concepts From Scratch
Sometimes, the most powerful trading education moment starts with a blank canvas. Markury's Whiteboard Mode overlays your entire screen with a solid background in one of four color options, giving you a clean, distraction-free space to draw chart structures, explain market phases, illustrate the anatomy of a pattern, or walk through a trading concept from first principles, without any background app competing for attention.
Works on Every Major Trading Platform
This is the foundation on which everything else is built. Markury works as a universal screen overlay, meaning it functions seamlessly over:
- TradingView (browser-based)
- MetaTrader 4 & MetaTrader 5
- Thinkorswim
- Any broker platform or trading terminal
- Zoom, Google Meet, Microsoft Teams during screen shares
- PowerPoint, PDFs, and educational materials
Privacy First: Nothing Leaves Your Device For professional traders handling sensitive portfolios, client accounts, or proprietary strategies, this matters enormously. Markury runs entirely locally on your device. No screen content is ever captured, uploaded, or transmitted. No background tracking. No cloud dependency. Your charts, your strategies, and your client data stay completely private.
How Traders Are Using Markury in Real-World Scenarios
Live Trading Room Hosts
Real-time trading rooms demand real-time communication. Markury's laser pointer and freehand tools let hosts mark entry zones, draw invalidation levels, and guide their members' attention across live charts as price develops, all without pausing the session, switching applications, or cluttering the chart with permanent marks that become confusing over time.
Trading Educators and YouTube Analysts
For traders who teach or produce content, Markury is the tool that bridges the gap between knowing your analysis and being able to communicate it with professional clarity on screen. Mark trend lines and patterns over live charts during recordings. Add text labels that appear as overlays. Use the laser pointer to direct the viewer's attention to the exact element you're discussing. Your content becomes dramatically more watchable, more educational, and more professional.
Day Traders Reviewing Their Sessions
Post-session review is where trading improvement actually happens. With Markury, you can pull up your chart after the session, circle the setup you took, mark where you entered and where you should have exited, annotate what the price action was telling you that you missed, and capture a timestamped screenshot for your journal, all in under two minutes per trade.
Swing Traders Sharing Analysis With Clients
Annotate your multi-timeframe analysis with clean labels, level markers, and directional arrows, then screenshot the final result for a professional, client-ready report. No external image editing. No switching tools. Just your analysis, marked up exactly as you see it, captured and ready to share.
Trading Course Creators
Whiteboard mode for concept teaching. Shape tools for clean structural diagrams. Text annotations for labeling zones and levels. Laser pointer for keeping students focused on exactly the right element at exactly the right moment. For anyone building a trading course or running live educational sessions, Markury is a complete toolkit in a single lightweight application.
Forex Traders Running Multi-Timeframe Analysis
Forex analysis rarely lives on a single chart. Markury's universal overlay means you can move between your weekly, daily, and intraday charts, annotating confluence zones, marking trend line breaks, and labeling key currency levels across every timeframe, all without switching tools or losing your annotations between windows.
Crypto Analysts & Social Media Content Creators
In the crypto space, your content quality is your credibility. Markury lets you annotate Bitcoin, Ethereum, or altcoin charts live on stream, mark breakout zones and target levels with precision, capture clean annotated screenshots for your X threads, and use the laser pointer to guide your Discord or YouTube audience's attention to exactly the right part of the chart at exactly the right moment.
Markury vs. Other Annotation Options for Traders
| Feature | Markury | Built-in Chart Tools | Epic Pen |
|---|---|---|---|
| Works Across All Apps | ✅ Universal Overlay | ❌ Platform-locked | ✅ Basic |
| Laser Pointer | ✅ Auto-fading ~1.5s | ❌ Not Available | ❌ Not Available |
| Text Annotations | ✅ Click anywhere on screen | ✅ Chart only | ❌ Not Available |
| Screenshot Tool | ✅ Full + Region + Auto-save | ❌ Not Available | ✅ Basic |
| Precision Shape Tools | ✅ Line, Rect, Circle, Ellipse, Arrow | ⚠️ Line only | ⚠️ Basic |
| Whiteboard Mode | ✅ 4 Background Colors | ❌ | ✅ Basic |
| Privacy, Local Only | ✅ Nothing uploaded | ❌ Cloud-based | ⚠️ Unspecified |
| Custom Keyboard Shortcuts | ✅ Fully Customizable | ❌ | ⚠️ Limited |
The conclusion here is straightforward: built-in chart tools are excellent within their own platforms, but stop the moment you go beyond a single application. For anything involving live sessions, screen sharing, recording, or cross-platform annotation, Markury is the complete solution.
How to Set Up Markury for Your Trading Workflow
Getting Markury running alongside your trading setup takes minutes. Here's how to do it right from day one:
- Visit markury.app and download for Mac or Windows
- Install and launch the floating toolbar: The toolbar appears on screen immediately. Drag it to a position that doesn't overlap your chart's key price action area, typically a corner or edge of your screen.
- Set up your trading keyboard shortcuts: Configure global shortcuts for your most-used tools: freehand pen, laser pointer, clear all annotations, and screenshot. Being able to activate and deactivate your annotation tools without touching the toolbar is essential during fast market conditions.
- Configure your Quick Colors for trading: Use Markury's four customizable Quick Color slots and set them up with trading-specific logic, for example:
- 🟢 Green: Support zones, long bias areas, targets
- 🔴 Red: Resistance zones, short bias areas, stop levels
- 🟡 Yellow: Key decision levels, watch zones
- ⚪ White: Trend lines, channel boundaries, neutral structure
- Open your trading platform and annotate: Markury runs silently in the background. Open TradingView, MetaTrader, or any platform of your choice, activate Markury's drawing tool with your shortcut, and begin annotating directly over your live charts.
Frequently Asked Questions
Can I draw on TradingView charts without using TradingView's built-in tools?
Yes. Markury works as a screen overlay, meaning it sits on top of TradingView regardless of whether you're using the browser or desktop version. Your annotations appear over the chart without being part of the TradingView drawing layer, useful for live sessions where you want temporary, real-time markings that don't persist on your saved chart layout.
What is the best tool to annotate charts during a live trading session?
Markury is purpose-built for exactly this scenario. Its hardware-accelerated drawing engine, auto-fading laser pointer, and instant clear-all function make it the most capable and fluid option available for live trading room annotation.
Does Markury work with MetaTrader 4 and MetaTrader 5?
Yes. Markury works with any desktop application, including MT4 and MT5. Draw trend lines, mark price levels, and annotate directly over your MetaTrader charts in real time.
Can I use Markury while screen sharing on Zoom or Google Meet?
Absolutely. Because Markury annotates at the screen level, everything you draw is visible to participants in your screen share, making it ideal for live trading sessions, client calls, and educational webinars.
How do I take annotated screenshots of my trading charts?
Use Markury's built-in screenshot tool, available as a global keyboard shortcut, to capture your annotated chart in full screen or a selected region. Screenshots are auto-timestamped and saved to your preferred local folder or clipboard instantly.
Will a screen annotation tool slow my trading platform?
Markury is engineered to be lightweight with minimal CPU usage. Its overlay engine is designed specifically not to interfere with the performance of the applications running underneath it. Your trading platform continues to run at full speed.
Is my trading data safe when using Markury?
Completely. Markury runs entirely locally on your device. No screen content is captured, transmitted, or stored remotely. For traders working with sensitive client or portfolio data, this local-first privacy architecture is a fundamental requirement, and Markury delivers it by design.
Is Markury useful for forex traders specifically?
Absolutely. Forex trading relies heavily on multi-timeframe analysis and real-time communication of currency pair setups. Markury works over any charting platform used in forex, TradingView, MetaTrader 4 and 5, cTrader, and any browser-based platform, making it ideal for annotating across timeframes and sharing analysis live.
Can crypto traders use Markury for YouTube or live stream content?
Yes, and this is one of Markury's strongest use cases in the crypto space. Draw over any crypto chart in real time during recordings or live streams, use the laser pointer to guide viewer attention without cluttering the chart, and capture annotated screenshots for posting analysis on X, Discord, or Telegram.
Does Markury work for stock market analysts presenting to teams or clients?
Yes. Because Markury operates as a universal screen overlay, it works during any screen share on Zoom, Teams, or Meet. Stock analysts can annotate technical setups, earnings charts, and sector comparisons live during client presentations, without any platform restrictions.
Conclusion: Annotate Smarter. Analyze Clearer. Present Better.
The best traders in the world don't just see the market clearly; they communicate what they see with precision, confidence, and clarity. Whether you're running a live trading room, building a trading education business, recording analysis for YouTube, or simply trying to improve your own trade review process, the quality of your visual communication directly affects how effectively your knowledge translates into results, for yourself and for the people watching you.
Built-in chart tools will take you part of the way. But the moment you step outside a single platform, into a screen share, a recording, a live session, or a multi-app workflow, you need a tool built for the whole picture.
Markury is that tool. Whether you trade stocks, forex, crypto, or options, whether you teach, analyze, create, or present, Markury adapts to your workflow completely.
Lightweight, precise, privacy-first, and purpose-built for real-time professional use. Markury gives every trader the visual communication toolkit that serious analysis deserves. From the auto-fading laser pointer that guides your audience without cluttering your charts, to the precision shape tools that make your structural analysis look as clean as it feels, to the one-click annotated screenshot that upgrades your trade journaling overnight, every feature was built with your workflow in mind.
The gap between what you see and what your audience understands is a drawing tool away from closing.
Ready to upgrade your screen annotations?
Try Markury, the modern onscreen drawing tool built for real-time presentations, remote collaboration, and seamless recording.